|
|
|
Porsche, and the Porsche crest are registered trademarks of Dr. Ing. h.c. F. Porsche AG.
This site is not affiliated with Porsche in any way. Its only purpose is to provide an online forum for car enthusiasts. All other trademarks are property of their respective owners. |
|
|


| Matt Romanowski |
 Feb 18 2014, 01:46 PM Feb 18 2014, 01:46 PM
Post
#1
|
|
Senior Member  Group: Members Posts: 878 Joined: 4-January 04 From: Manchester, NH Member No.: 1,507 |
If anyone is interested in getting a data acquisition system for their car, get in touch with me. I can offer great deals on AiM products. I can help you out with anything from a Solo that mounts on the windshield to a full dash setup with sensors on everything. I can also help with the analysis and understanding how to work with the program. Shoot me an email at matt @ TrailBrake.net.
|
   |

 
|
  |
Replies
| Matt Romanowski |
Feb 24 2014, 04:18 PM
Post
#2
|
|
Senior Member Group: Members Posts: 878 Joined: 4-January 04 From: Manchester, NH Member No.: 1,507 |
I thought since a lot of people haven't used data before, I would give a couple of screen shots from Race Studio 2 to show what you get and how you can use it. This data is from my 914 track car with an AiM SOLO.
This first graph is just a quick view of some of the things you can track (called measures). Here I did speed, corner radius, and braking G force (longitudinal G). From the shapes of these graphs you can tell if you are applying the brake well, turning in correctly, early/late apexing, and a bunch more. I also have the friction circle displayed along with a GPS track map showing exactly where you drove colored with the speed of the car. Using just this basic data, I've helped people take 4-5 seconds a lap off their time on a 1:25 long track. 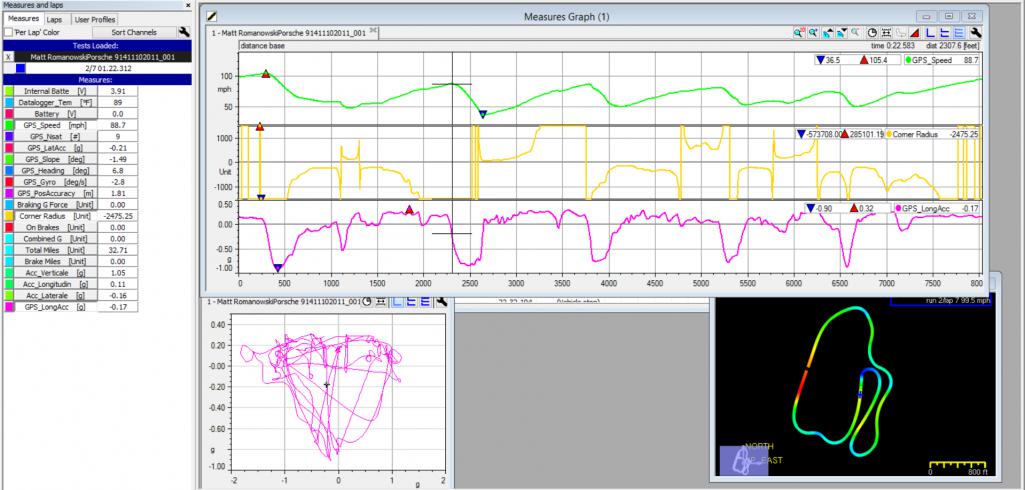 This next chart is a review chart that you can make up. Here I calculated how many miles were driven during the session, how many miles you were on the brakes, maximum and minimum G forces, speeds, etc. This is a great way to watch how long tires and brakes last, how many miles you drove for part time out intervals, etc. Using a chart like this is also an easy way to see when you're G-forces start to go down and your tires are wearing out! You can do this (with more options) for any measure you want. 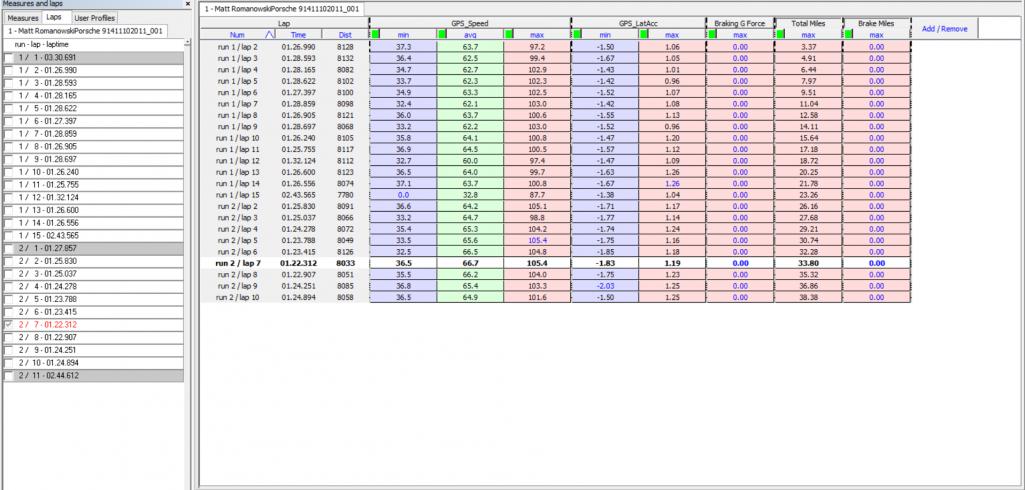 This final one is a comparison between two drivers. You can see they, well me and my co-driver, took different lines (also in the GPS map) and had different speeds. You can then compare what was faster or not. The graph on the bottom is the difference in time, so you can use the shape of that graph right away to pinpoint where one person was faster or slower. You don't have to compare against another driver either, you can compare your own laps from the same session or different sessions as well. You can also zoom in on the GPS map and see exactly how different the lines were in specific areas. 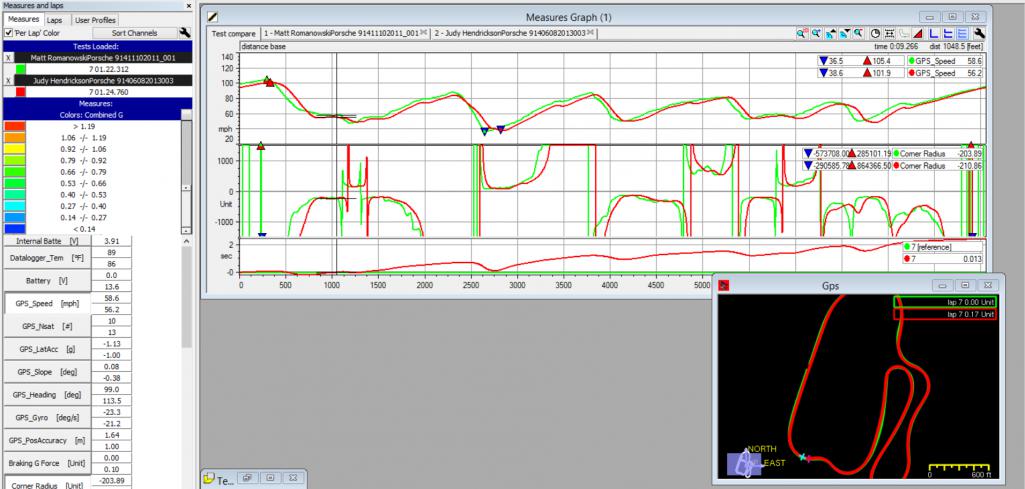 It's pretty amazing that 5 years ago this level of data probably cost over $2,000 and now you can do it for $400! |
|
|
|
Posts in this topic
 Matt Romanowski Data Acquisition Deals Feb 18 2014, 01:46 PM
 Seabird Hey Matt I have checked out your website in the pa... Feb 18 2014, 03:28 PM Jetsetsurfshop I'm interested too. I noticed your dash in ano... Feb 18 2014, 06:28 PM brant Data systems can provide gauge info. But the are r... Feb 18 2014, 07:59 PM Matt Romanowski
Hey Matt I have checked out your website in the p... Feb 18 2014, 08:59 PM
Seabird Hey Matt I have checked out your website in the pa... Feb 18 2014, 03:28 PM Jetsetsurfshop I'm interested too. I noticed your dash in ano... Feb 18 2014, 06:28 PM brant Data systems can provide gauge info. But the are r... Feb 18 2014, 07:59 PM Matt Romanowski
Hey Matt I have checked out your website in the p... Feb 18 2014, 08:59 PM
 Seabird
So, long answer to your question - for <... Feb 19 2014, 09:35 AM Matt Romanowski I should have added too, if people need help with ... Feb 18 2014, 09:00 PM Matt Romanowski
So, long answer to your question - for <... Feb 19 2014, 10:12 AM Jetsetsurfshop Matt,
I did do some research last night on the MXL... Feb 19 2014, 10:39 AM Matt Romanowski
Matt,
I did do some research last night on the MX... Feb 19 2014, 04:02 PM Seabird Matt,
Whats the deal with file sharing? Do all t... Feb 19 2014, 09:33 PM Matt Romanowski
Matt,
Whats the deal with file sharing? Do all ... Feb 19 2014, 09:51 PM campbellcj Interesting timing on this discussion as I just ju... Feb 19 2014, 11:53 PM Seabird I downloaded the RS2 AIM software to play around w... Feb 20 2014, 11:10 AM Matt Romanowski I'm working on getting you something from thos... Feb 20 2014, 02:52 PM f1rocks +1 for the AIM system.
Used a Racepak IQ3 for a f... Feb 20 2014, 03:20 PM Matt Romanowski
+1 for the AIM system.
Used a Racepak IQ3 for a ... Feb 20 2014, 03:28 PM Jetsetsurfshop Thanks Matt for the info. Looks like something I... Feb 20 2014, 07:17 PM brant Matt,
without knowing which track and the topogr... Feb 25 2014, 08:09 PM Matt Romanowski
Matt,
without knowing which track and the topog... Feb 25 2014, 09:15 PM Jetsetsurfshop Thx Matt.
:Qarl: May 15 2014, 10:56 AM Seabird
Thx Matt.
:Qarl:
You picked one of these up S... May 15 2014, 11:13 AM Jetsetsurfshop
Thx Matt.
:Qarl:
You picked one of these up ... May 15 2014, 02:42 PM Seabird Motor is out on mine and I am still planning on ma... May 15 2014, 02:50 PM Jetsetsurfshop
Motor is out on mine and I am still planning on m... May 15 2014, 03:42 PM Matt Romanowski Glad you got it and I hope you make the event. Let... May 19 2014, 07:20 PM Jetsetsurfshop Here's some track data from my AiM solo I boug... Jul 13 2014, 06:50 AM Seabird Shane,
That screen your showing us is telling yo... Jul 13 2014, 07:20 AM Jetsetsurfshop
Shane,
That screen your showing us is telling y... Jul 13 2014, 10:02 AM Matt Romanowski Here are a couple of notes on the data. Was the bl... Jul 13 2014, 08:35 PM Jetsetsurfshop
Here are a couple of notes on the data. Was the b... Jul 17 2014, 09:51 AM Jetsetsurfshop Wow Matt thanks for the feedback. I'm going to... Jul 13 2014, 09:46 PM Matt Romanowski The overall speed change was due to the cooler wea... Jul 14 2014, 08:53 AM andrew15 Thanks for all your help Matt! I got the AIM E... Jul 16 2014, 07:52 AM naro914 We have an AIM Solo - which will be a lot more fun... Jul 16 2014, 03:46 PM Matt Romanowski Bob - you are right on with the predictive timing.... Jul 16 2014, 08:31 PM campbellcj Well, I got some bummer news today - the Racepak G... Aug 20 2014, 10:01 PM Matt Romanowski
Well, I got some bummer news today - the Racepak ... Aug 21 2014, 01:31 PM campbellcj
What a bummer! When you are ready, let's ... Aug 21 2014, 10:33 PM
Seabird
So, long answer to your question - for <... Feb 19 2014, 09:35 AM Matt Romanowski I should have added too, if people need help with ... Feb 18 2014, 09:00 PM Matt Romanowski
So, long answer to your question - for <... Feb 19 2014, 10:12 AM Jetsetsurfshop Matt,
I did do some research last night on the MXL... Feb 19 2014, 10:39 AM Matt Romanowski
Matt,
I did do some research last night on the MX... Feb 19 2014, 04:02 PM Seabird Matt,
Whats the deal with file sharing? Do all t... Feb 19 2014, 09:33 PM Matt Romanowski
Matt,
Whats the deal with file sharing? Do all ... Feb 19 2014, 09:51 PM campbellcj Interesting timing on this discussion as I just ju... Feb 19 2014, 11:53 PM Seabird I downloaded the RS2 AIM software to play around w... Feb 20 2014, 11:10 AM Matt Romanowski I'm working on getting you something from thos... Feb 20 2014, 02:52 PM f1rocks +1 for the AIM system.
Used a Racepak IQ3 for a f... Feb 20 2014, 03:20 PM Matt Romanowski
+1 for the AIM system.
Used a Racepak IQ3 for a ... Feb 20 2014, 03:28 PM Jetsetsurfshop Thanks Matt for the info. Looks like something I... Feb 20 2014, 07:17 PM brant Matt,
without knowing which track and the topogr... Feb 25 2014, 08:09 PM Matt Romanowski
Matt,
without knowing which track and the topog... Feb 25 2014, 09:15 PM Jetsetsurfshop Thx Matt.
:Qarl: May 15 2014, 10:56 AM Seabird
Thx Matt.
:Qarl:
You picked one of these up S... May 15 2014, 11:13 AM Jetsetsurfshop
Thx Matt.
:Qarl:
You picked one of these up ... May 15 2014, 02:42 PM Seabird Motor is out on mine and I am still planning on ma... May 15 2014, 02:50 PM Jetsetsurfshop
Motor is out on mine and I am still planning on m... May 15 2014, 03:42 PM Matt Romanowski Glad you got it and I hope you make the event. Let... May 19 2014, 07:20 PM Jetsetsurfshop Here's some track data from my AiM solo I boug... Jul 13 2014, 06:50 AM Seabird Shane,
That screen your showing us is telling yo... Jul 13 2014, 07:20 AM Jetsetsurfshop
Shane,
That screen your showing us is telling y... Jul 13 2014, 10:02 AM Matt Romanowski Here are a couple of notes on the data. Was the bl... Jul 13 2014, 08:35 PM Jetsetsurfshop
Here are a couple of notes on the data. Was the b... Jul 17 2014, 09:51 AM Jetsetsurfshop Wow Matt thanks for the feedback. I'm going to... Jul 13 2014, 09:46 PM Matt Romanowski The overall speed change was due to the cooler wea... Jul 14 2014, 08:53 AM andrew15 Thanks for all your help Matt! I got the AIM E... Jul 16 2014, 07:52 AM naro914 We have an AIM Solo - which will be a lot more fun... Jul 16 2014, 03:46 PM Matt Romanowski Bob - you are right on with the predictive timing.... Jul 16 2014, 08:31 PM campbellcj Well, I got some bummer news today - the Racepak G... Aug 20 2014, 10:01 PM Matt Romanowski
Well, I got some bummer news today - the Racepak ... Aug 21 2014, 01:31 PM campbellcj
What a bummer! When you are ready, let's ... Aug 21 2014, 10:33 PM |
1 User(s) are reading this topic (1 Guests and 0 Anonymous Users)
0 Members:

|
Lo-Fi Version | Time is now: 7th June 2024 - 09:45 AM |
Invision Power Board
v9.1.4 © 2024 IPS, Inc.