|
|
|
Porsche, and the Porsche crest are registered trademarks of Dr. Ing. h.c. F. Porsche AG.
This site is not affiliated with Porsche in any way. Its only purpose is to provide an online forum for car enthusiasts. All other trademarks are property of their respective owners. |
|
|


| Not_A_Six |
 Aug 15 2020, 10:22 AM Aug 15 2020, 10:22 AM
Post
#1
|
|
Member  Group: Members Posts: 110 Joined: 28-November 18 From: North Idaho Member No.: 22,682 Region Association: Pacific Northwest |
EDIT: See post #17 for an update that contradicts some of the findings in this OP. See also post #29 for the final results.
I've recently gone down the rabbit hole of D-Jet and MPS tuning and wanted to post what I've learned in the hopes that it may help others. I also hope to start a discussion with some of the experts here in case I've missed something, or there are errors in my analysis. Background: With the increased displacement (2056cc) and non-stock cam (Webcam 73) in my engine, I was experiencing Air-Fuel Mixture (AFR) issues across the range of temperature, load, and rpm conditions. This post concerns MPS tuning. At the moment, I'm also working on modifying component values inside the ECU to change the Volumetric Efficiency curve to better match the non-stock AFR vs RPM characteristics of my engine. If there is any interest in poking around that deep in the bowels of D-Jet, I'll start a thread when I finish. (IMG:style_emoticons/default/blink.gif) Engine Configuration: '73 2.0 Displacement: 2056cc Cam: Webcam 73 ECU: Porsche nnn906021E (Bosch 280000037) MPS: Porsche 022906051E (Bosch 0280100049) w/ Tangerine Racing tuning kit + spacer ring; tuned to emulate 0280100037 CHT: 0280130017 w/ 270-ohm ballast resistor and steel spacer Vacuum Hoses routed per @JeffBowlsby (see link below) Fuel Pressure: 35 psi (at the moment -- still tuning) PCV: Modern PCV valve routed to plenum Ignition: 123Ignition PORSCHE-4-R-V-IE, running profile "1" w/ Vac Advance Timing: 27 degrees at 3500 rpm (w/o vacuum adv/ret) Equipment used: Generic handheld vacuum pump/gauge misc hoses+fittings AMPROBE LCR55A meter (on 20H scale) Innovate Motorsports (3837) LM-2 (BASIC) Digital Air/Fuel Ratio Wideband Meter w/ Bosch LSU 4.9 Home-fabricated tailpipe "Stinger" w/ O2 Sensor Bung TIG welded on Reference Info: Vacuum Hose Routing MPS Theory of Operation @pbanders AFR vs Manifold Vacuum Issue @Demick Analysis: 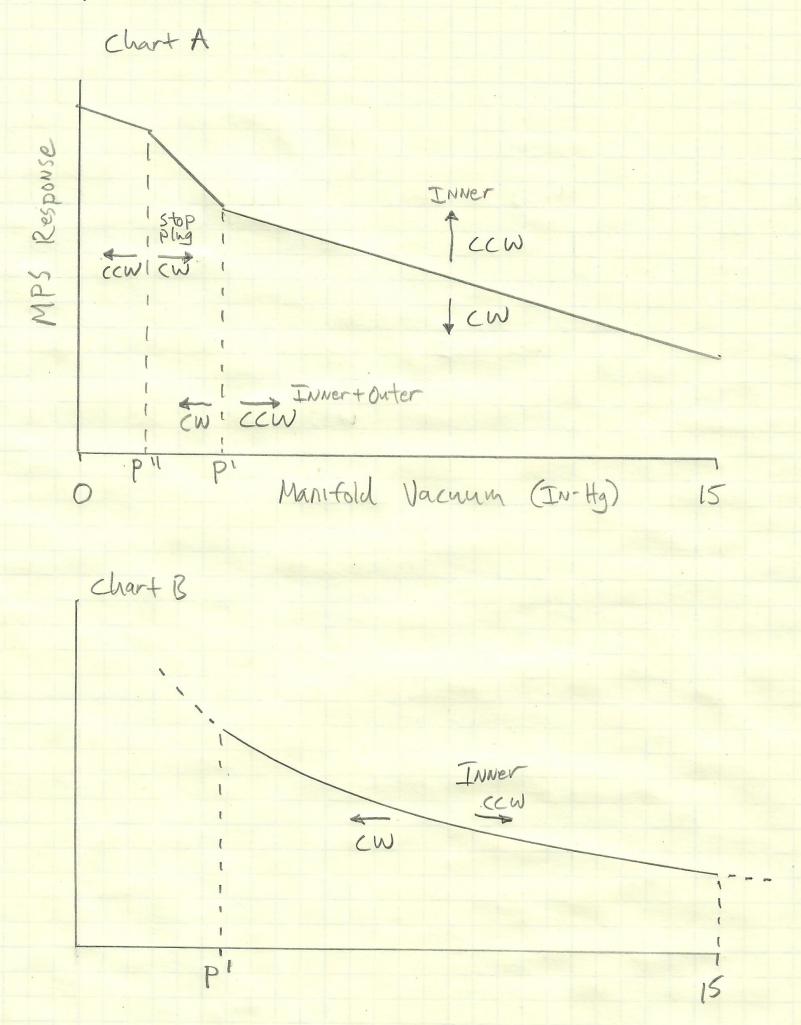 As you can see in the "Chart A" sketch above, the MPS Inner Screw (in isolation), Outer Screw+Inner Screw (together), and Stop Plug Screw can be used to tune the MPS's affect on the AFR (via its effect on the Fuel Injection pulse width) vs Manifold Vacuum. As shown, the Inner Screw affects the mixture over the whole vacuum range; the Inner+Outer Screw controls the onset pressure P' where the diaphragm begins to lift off the part-load stop; the Stop Plug Screw controls the final pressure P'' where the diaphragm comes to rest on the full-load stop. On this chart, "up" corresponds to a longer FI pulse; "down" to a shorter FI pulse. For details, see pbanders's excellent link, above. I had previously thought that the effect of the Inner Screw was similar to that of changing the fuel pressure via the fuel pressure regulator. Namely: Inner Screw CCW = Increase Fuel Pressure => Richer AFR across entire vacuum range Inner Screw CW = Decrease Fuel Pressure => Leaner AFR across entire vacuum range There appeared to be no way to change the slope of the MPS Response curve in the region from 15 In-Hg to P'. And, I was experiencing the same problem that Demick posted about years ago in the thread linked above. Namely, the AFR would become too lean under moderate-load conditions across all RPM's, like this (from Demick's post): (IMG:http://www.914world.com/bbs2/uploads/post-2-1096387565.jpg) To fix the lean condition around 6-8 In-Hg, it's really necessary to change the slope of the MPS response curve, not just raise or lower the whole curve. However, there appears to be hope. It seems that the MPS inductance is not simply linear WRT manifold pressure in the 15 In-Hg to P' region. I speculate that this may be due to non-linearity in the MPS Inductance across its range of movement and/or the effect of the MPS spring. The result is that the curve seems to look more like the "Chart B" sketch above. And, the effect of turning the MPS inner screw isn't really raising or lower the entire curve, but rather shifting the Chart B curve left/right. (Chart B is a really rough sketch, and may even have the convexity backwards. For a more quantitative look, see below.) I measured the inductance of my MPS at two different inner-screw settings: The red curve is the MPS tuned to pbanders's values corrected for 700 Torr ambient pressure. The blue curve represents an attempt to richen the AFR by turning the inner screw CCW. 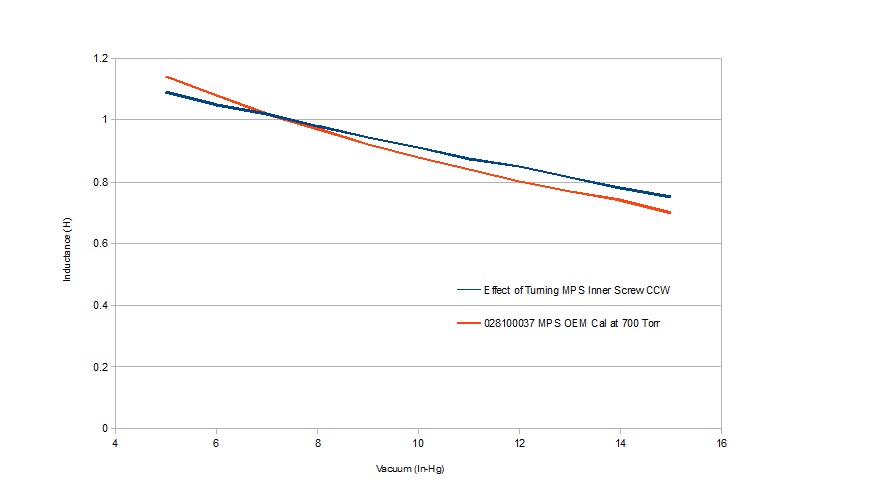 As you can see, the slope of the red curve is steeper than the blue curve in this region. Apparently, turning the inner screw CCW has the effect of reducing the slope by raising the right end, rather than raising the whole curve. I'm surprised that the curves cross around 7 In-Hg and that the blue curve value is less than the red curve value at the left side of the chart. This may be due to the effect of the part-load stop coming into play near P', measurement error, or something else. (IMG:style_emoticons/default/confused24.gif) The salient point, however, is that adjusting the inner screw affects the slope of the curve, whereas presumably adjusting the fuel pressure does not. The opens the possibility of tuning the AFR vs Manifold pressure curve by trading off fuel pressure vs inner screw position: Increase Fuel Pressure + Turn Inner Screw CW => Enrich 6-8 In-Hg region Decrease Fuel Pressure + Turn Inner Screw CCW = Lean out 6-8 In-Hg region I experienced the same problem that Demick did (too lean at 6-8 In-Hg across all RPM), and have largely solved the problem by adjusting the fuel pressure up (to 35 psi currently), then tuning the MPS to set the AFR across the entire range of manifold vacuum levels. I hope this is helpful to somebody. Comments are welcome. If I've made any errors, please feel free to beat me over the head. (IMG:style_emoticons/default/splat.gif) Cheers. (IMG:style_emoticons/default/beerchug.gif) |
   |

 
|
  |
Replies
| Olympic 914 |
Aug 15 2020, 08:01 PM
Post
#2
|
|
Group: Members Posts: 1,746 Joined: 7-July 11 From: Pittsburgh PA Member No.: 13,287 Region Association: North East States |
On your Blue/Red graph, how many data points did you use? Every( in Hg) ?
I was thinking of mapping my MPS. Was there a reason you did not map it to "0" Did you correct your numbers to sea level? Could you share the formula? please keep it simple for me. My location is about 1000 ft alt |
|
|
|
| Not_A_Six |
Aug 16 2020, 07:22 AM
Post
#3
|
|
Member Group: Members Posts: 110 Joined: 28-November 18 From: North Idaho Member No.: 22,682 Region Association: Pacific Northwest |
QUOTE(Olympic 914 @ Aug 15 2020, 07:01 PM)  On your Blue/Red graph, how many data points did you use? Every( in Hg) ? I was thinking of mapping my MPS. Was there a reason you did not map it to "0" Did you correct your numbers to sea level? Could you share the formula? please keep it simple for me. My location is about 1000 ft alt I measured the inductance and collected data from 0-15 In-Hg, at 1 In-Hg intervals. And, I have a bunch of different MPS "tunes" that I was experimenting with as I played with fuel pressure, ignition timing, etc. On my graph, I just plotted the data from 5 to 15 In-Hg to show that the slope would change in that region as you turned the MPS inner screw. The red and blue curves diverge below 5 In-Hg due to different tuning in that region. pbanders's values for the 028100037 MPS measured at 726 Torr (1260 ft elevation) are: 0 in Hg 1.44H 4 in Hg 1.26H 15 in Hg 0.72H I'm at 2250 ft elevation (700 Torr). So, those values at my elevation are roughly: 0 in Hg 1.39H 4 in Hg 1.22H 15 in Hg 0.70H The red curve on my graph was tuned to these values, and has data points every 1 In-Hg. To adjust pbanders's numbers for my elevation, I used the simple straight-line method outlined in his MPS link in my OP. There are more accurate ways to make the altitude correction, but this was easy and good enough for my purposes: "The simplest way to calculate a correction factor is to compare the absolute pressure of your location in Torr to my absolute pressure, 726 Torr. For example: Sea level: absolute pressure is 760 Torr. Therefore, the correction factor is 760/723 = 1.05 . So, for a 0 280 100 043 MPS, the 0, 4, and 15 in. Hg calibration values would be, 1.45, 1.24, and 0.75 H, respectively." All of these values were measured with an LCR55A meter on the 20H scale. That meter is now made by Amprobe instead of Wavetek. pbanders's values were apparently measured with an older Wavetek meter; mine were measured with a newer Amprobe version. I believe the calibration and values are the same for both meters. It's important to note that the meter type/model and even scale used will likely read different values than those above. So, my numbers in this thread shouldn't be used as any sort of tuning values for any other MPS, in any other car, at any other elevation. My tuning process was to start with pbanders's values adjusted for my altitude (the red curve), then make adjustments to fuel pressure and MPS from that starting point based on O2 readings while driving under different conditions. FWIW, my goal AFR tuning values are: Hot Idle: 12.5-13 Hot Cruise: 13-13.5 Hot WOT: 12.5 This is 45+ year-old d-jet, so those AFR numbers are expected to vary a bit over rpm, vacuum, engine temp, altitude, etc. Cheers. (IMG:style_emoticons/default/beerchug.gif) |
|
|
|
Posts in this topic
Not_A_Six MPS Tuning Analysis Aug 15 2020, 10:22 AM Olympic 914 I will be watching this closely.
Had considered ... Aug 15 2020, 11:16 AM JOEPROPER This is a great thread with great links. A lot of... Aug 15 2020, 01:00 PM Bleyseng With a stock cam and the slight increase in piston... Aug 15 2020, 02:21 PM
Olympic 914 I will be watching this closely.
Had considered ... Aug 15 2020, 11:16 AM JOEPROPER This is a great thread with great links. A lot of... Aug 15 2020, 01:00 PM Bleyseng With a stock cam and the slight increase in piston... Aug 15 2020, 02:21 PM
 Not_A_Six
With a stock cam and the slight increase in pisto... Aug 15 2020, 02:35 PM JOEPROPER Webcam 73... Aug 15 2020, 05:56 PM Not_A_Six
Webcam 73...
Your engine setup sounds similar t... Aug 15 2020, 06:04 PM BeatNavy Just for fun I'll throw in some of my data and... Aug 16 2020, 06:19 AM Not_A_Six
Just for fun I'll throw in some of my data an... Aug 16 2020, 12:49 PM Not_A_Six *** UPDATE ***
I was bothered by the Inductance v... Aug 17 2020, 04:31 PM Frank S [quote name='Not_A_Six' date='Aug 18 2... Aug 18 2020, 12:06 PM Not_A_Six Awesome insights! Thanks, Frank. Please see m... Aug 18 2020, 12:29 PM Frank S
Awesome insights! Thanks, Frank. Please see ... Aug 19 2020, 12:24 AM Not_A_Six *** UPDATE ***
Based on the data from post #17 an... Aug 19 2020, 04:13 PM Olympic 914
[b]*** UPDATE ***
Based on the data from post #1... Aug 19 2020, 06:16 PM Not_A_Six
This thread is great.
Did you happen to break o... Aug 19 2020, 06:27 PM Bleyseng Using a Wavetek just like Anders I came up with th... Aug 16 2020, 07:14 AM Olympic 914 This is great.
I have been hoping others would po... Aug 16 2020, 08:44 AM JeffBowlsby "2. Inductance meters seem to vary significan... Aug 16 2020, 09:08 AM Not_A_Six The main reason that different meters give differe... Aug 16 2020, 09:54 AM Superhawk996 :D
Great thread. Love seeing a logical, methodi... Aug 16 2020, 09:45 AM Bleyseng My readings for a 037 MPS after testing several kn... Aug 17 2020, 04:51 PM Not_A_Six
My readings for a 037 MPS after testing several k... Aug 17 2020, 05:04 PM Olympic 914 The engine configuration I am running basically mi... Aug 17 2020, 05:57 PM Not_A_Six
The engine configuration I am running basically m... Aug 17 2020, 06:19 PM Olympic 914
The choice of CHT sensor and ballast resistor ... Aug 17 2020, 06:46 PM Not_A_Six
The choice of CHT sensor and ballast resistor... Aug 17 2020, 06:52 PM McMark I'm thinking about adding a warmup pot, too. ... Aug 18 2020, 02:35 PM Olympic 914 I will plot the points on my MPS but I am not sure... Aug 17 2020, 06:09 PM 914_teener I.m a little confused with parts of your posts par... Aug 20 2020, 10:09 PM Not_A_Six
I.m a little confused with parts of your posts pa... Aug 21 2020, 10:34 AM Olympic 914 Got my MPS graph done
0 = 1.52
4 = 1.34
15 = 0.8... Aug 27 2020, 04:46 PM rjames I know I'm late to the party- this thread is o... Sep 3 2021, 07:21 PM rjames Speaking of MPS tuning...
How does one know when ... Sep 3 2021, 11:34 PM adolimpio
Speaking of MPS tuning...
How does one know when... Sep 5 2021, 06:32 AM rjames
[quote name='rjames' post='2942876' date='Sep 4 2... Sep 6 2021, 12:54 AM adolimpio I suspect that you're losing vacuum because yo... Sep 6 2021, 05:37 AM rjames
I suspect that you're losing vacuum because y... Sep 6 2021, 10:50 AM Robarabian I hate to revive this, but....I am now diving into... Sep 13 2022, 06:47 PM emerygt350
I hate to revive this, but....I am now diving int... Sep 13 2022, 07:22 PM mgphoto This is what I use.
Inside screw only cw part loa... Sep 24 2022, 05:22 PM Robarabian @mgphoto thank you I will use those as I progress... Sep 25 2022, 08:36 AM emerygt350
[b]@[url=http://www.914world.com/bbs2/index.php?s... Sep 25 2022, 08:48 AM Eric_Shea
Sorry! IT’S A JOKE!!! :D Sep 26 2022, 03:26 PM emerygt350 That's awesome. Sep 26 2022, 04:49 PM windforfun
Sorry! IT’S A JOKE!!! :D
... Dec 1 2022, 05:12 PM JeffBowlsby
Sorry! IT’S A JOKE!!! :D
... Dec 1 2022, 08:50 PM rjames :rotfl:
The guy that spent his life trying to dia... Sep 26 2022, 05:41 PM gonzo54 I'm not sure I understand half of the technica... Dec 1 2022, 01:24 PM Quinn Moore
I'm not sure I understand half of the technic... Dec 1 2022, 02:05 PM gonzo54
I'm not sure I understand half of the techni... Dec 1 2022, 02:14 PM ChrisFoley
I've sent (2) to FIC. for testing and rebuil... Dec 3 2022, 05:13 AM Quinn Moore
I've sent (2) to FIC. for testing and rebui... Dec 3 2022, 05:46 AM Robarabian I'll vouch for Chris' kit, it is what I us... Dec 3 2022, 08:59 AM gonzo54
I'm not sure I understand half of the technic... Dec 1 2022, 08:15 PM Robarabian Hi Rick. As I said in my post, I obtained the same... Dec 1 2022, 10:15 PM gonzo54
Hi Rick. As I said in my post, I obtained the sam... Dec 2 2022, 06:22 PM Robarabian PM me and we can talk offline and keep this from b... Dec 2 2022, 09:51 PM emerygt350 There are probably about three people that fit tha... Dec 1 2022, 04:52 PM gonzo54
There are probably about three people that fit th... Dec 1 2022, 05:09 PM emerygt350
There are probably about three people that fit t... Dec 1 2022, 07:35 PM emerygt350 Exactly, go with tangerine racing. Dec 3 2022, 09:10 PM
Not_A_Six
With a stock cam and the slight increase in pisto... Aug 15 2020, 02:35 PM JOEPROPER Webcam 73... Aug 15 2020, 05:56 PM Not_A_Six
Webcam 73...
Your engine setup sounds similar t... Aug 15 2020, 06:04 PM BeatNavy Just for fun I'll throw in some of my data and... Aug 16 2020, 06:19 AM Not_A_Six
Just for fun I'll throw in some of my data an... Aug 16 2020, 12:49 PM Not_A_Six *** UPDATE ***
I was bothered by the Inductance v... Aug 17 2020, 04:31 PM Frank S [quote name='Not_A_Six' date='Aug 18 2... Aug 18 2020, 12:06 PM Not_A_Six Awesome insights! Thanks, Frank. Please see m... Aug 18 2020, 12:29 PM Frank S
Awesome insights! Thanks, Frank. Please see ... Aug 19 2020, 12:24 AM Not_A_Six *** UPDATE ***
Based on the data from post #17 an... Aug 19 2020, 04:13 PM Olympic 914
[b]*** UPDATE ***
Based on the data from post #1... Aug 19 2020, 06:16 PM Not_A_Six
This thread is great.
Did you happen to break o... Aug 19 2020, 06:27 PM Bleyseng Using a Wavetek just like Anders I came up with th... Aug 16 2020, 07:14 AM Olympic 914 This is great.
I have been hoping others would po... Aug 16 2020, 08:44 AM JeffBowlsby "2. Inductance meters seem to vary significan... Aug 16 2020, 09:08 AM Not_A_Six The main reason that different meters give differe... Aug 16 2020, 09:54 AM Superhawk996 :D
Great thread. Love seeing a logical, methodi... Aug 16 2020, 09:45 AM Bleyseng My readings for a 037 MPS after testing several kn... Aug 17 2020, 04:51 PM Not_A_Six
My readings for a 037 MPS after testing several k... Aug 17 2020, 05:04 PM Olympic 914 The engine configuration I am running basically mi... Aug 17 2020, 05:57 PM Not_A_Six
The engine configuration I am running basically m... Aug 17 2020, 06:19 PM Olympic 914
The choice of CHT sensor and ballast resistor ... Aug 17 2020, 06:46 PM Not_A_Six
The choice of CHT sensor and ballast resistor... Aug 17 2020, 06:52 PM McMark I'm thinking about adding a warmup pot, too. ... Aug 18 2020, 02:35 PM Olympic 914 I will plot the points on my MPS but I am not sure... Aug 17 2020, 06:09 PM 914_teener I.m a little confused with parts of your posts par... Aug 20 2020, 10:09 PM Not_A_Six
I.m a little confused with parts of your posts pa... Aug 21 2020, 10:34 AM Olympic 914 Got my MPS graph done
0 = 1.52
4 = 1.34
15 = 0.8... Aug 27 2020, 04:46 PM rjames I know I'm late to the party- this thread is o... Sep 3 2021, 07:21 PM rjames Speaking of MPS tuning...
How does one know when ... Sep 3 2021, 11:34 PM adolimpio
Speaking of MPS tuning...
How does one know when... Sep 5 2021, 06:32 AM rjames
[quote name='rjames' post='2942876' date='Sep 4 2... Sep 6 2021, 12:54 AM adolimpio I suspect that you're losing vacuum because yo... Sep 6 2021, 05:37 AM rjames
I suspect that you're losing vacuum because y... Sep 6 2021, 10:50 AM Robarabian I hate to revive this, but....I am now diving into... Sep 13 2022, 06:47 PM emerygt350
I hate to revive this, but....I am now diving int... Sep 13 2022, 07:22 PM mgphoto This is what I use.
Inside screw only cw part loa... Sep 24 2022, 05:22 PM Robarabian @mgphoto thank you I will use those as I progress... Sep 25 2022, 08:36 AM emerygt350
[b]@[url=http://www.914world.com/bbs2/index.php?s... Sep 25 2022, 08:48 AM Eric_Shea
Sorry! IT’S A JOKE!!! :D Sep 26 2022, 03:26 PM emerygt350 That's awesome. Sep 26 2022, 04:49 PM windforfun
Sorry! IT’S A JOKE!!! :D
... Dec 1 2022, 05:12 PM JeffBowlsby
Sorry! IT’S A JOKE!!! :D
... Dec 1 2022, 08:50 PM rjames :rotfl:
The guy that spent his life trying to dia... Sep 26 2022, 05:41 PM gonzo54 I'm not sure I understand half of the technica... Dec 1 2022, 01:24 PM Quinn Moore
I'm not sure I understand half of the technic... Dec 1 2022, 02:05 PM gonzo54
I'm not sure I understand half of the techni... Dec 1 2022, 02:14 PM ChrisFoley
I've sent (2) to FIC. for testing and rebuil... Dec 3 2022, 05:13 AM Quinn Moore
I've sent (2) to FIC. for testing and rebui... Dec 3 2022, 05:46 AM Robarabian I'll vouch for Chris' kit, it is what I us... Dec 3 2022, 08:59 AM gonzo54
I'm not sure I understand half of the technic... Dec 1 2022, 08:15 PM Robarabian Hi Rick. As I said in my post, I obtained the same... Dec 1 2022, 10:15 PM gonzo54
Hi Rick. As I said in my post, I obtained the sam... Dec 2 2022, 06:22 PM Robarabian PM me and we can talk offline and keep this from b... Dec 2 2022, 09:51 PM emerygt350 There are probably about three people that fit tha... Dec 1 2022, 04:52 PM gonzo54
There are probably about three people that fit th... Dec 1 2022, 05:09 PM emerygt350
There are probably about three people that fit t... Dec 1 2022, 07:35 PM emerygt350 Exactly, go with tangerine racing. Dec 3 2022, 09:10 PM |
2 User(s) are reading this topic (2 Guests and 0 Anonymous Users)
0 Members:

|
Lo-Fi Version | Time is now: 18th August 2025 - 11:40 PM |
Invision Power Board
v9.1.4 © 2025 IPS, Inc.